Text size
Line height
Text spacing



Patient dashboards are a powerful tool to view a patient's key history at a glance.
For your convenience, you can configure patient dashboards to review past surgeries, clinical notes, specific readings or results, and more. This provides a clear overview of the patient's clinical history and enables comprehensive consultations without sifting through folders or files to find key points and clinical notes.

| Date of Change | Changes | Editor |
| 2026 09 28 | Established Page | Chendene Barnard |
| GoodX Course: Patient Dashboard

Where can the “Patient Dashboard” be accessed?
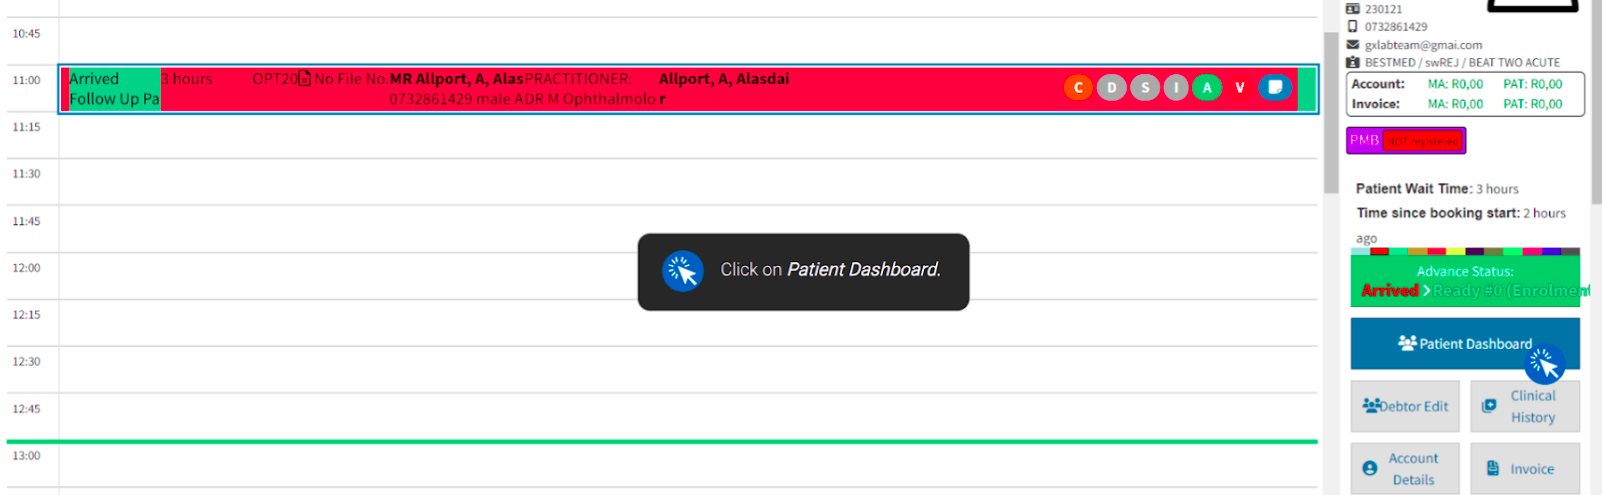
From the diary booking screen
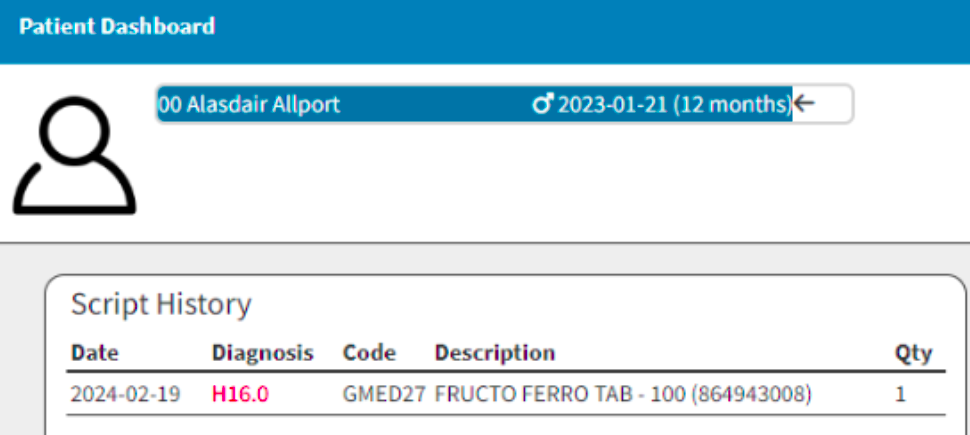
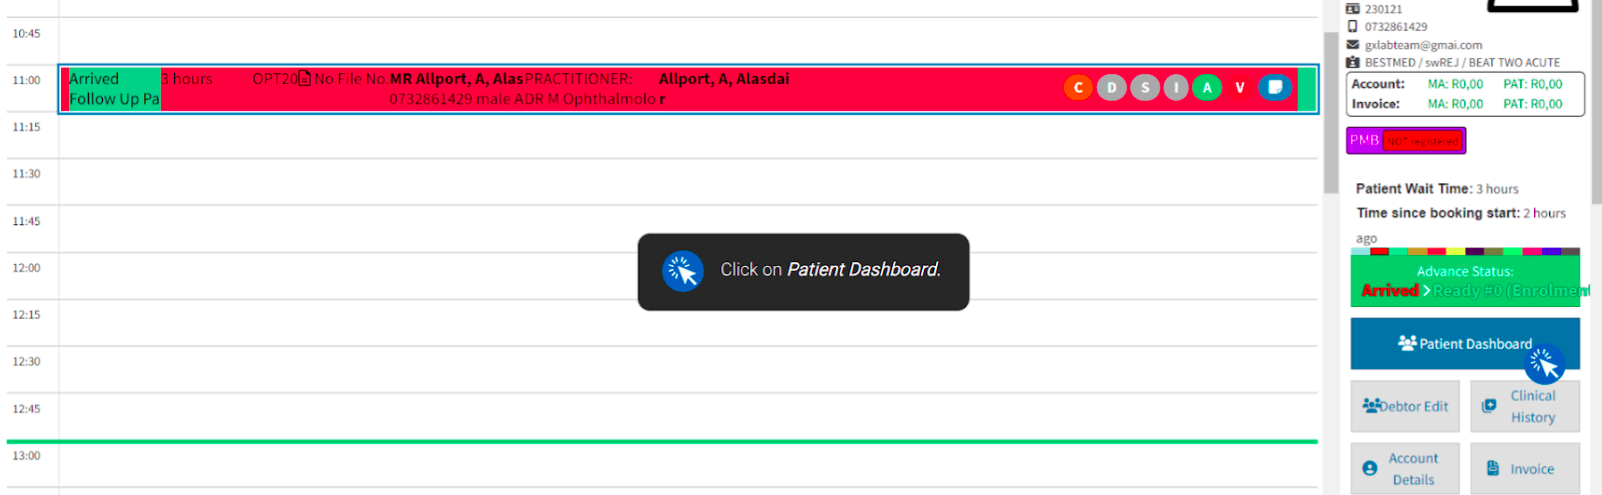
The patient dashboard can be located by selecting "Diary" from the main GoodX wheel. From the Diary tab, click the relevant patient booking to display the patient's information on the debtor panel alongside the booking, along with other quick-access shortcuts in the side panel. From this side panel, select "Patient Dashboard", ensuring the arrow indicator points to the correct patient. Once selected, your configured dashboard profiles will be displayed. Where clinical information has been completed for the patient, the linked data will be reflected according to that specific user profile setup.
Always ensure the arrow next to the patient's name is correct, as it indicates that the clinical data currently displayed belongs to that patient.
From the debtor panel
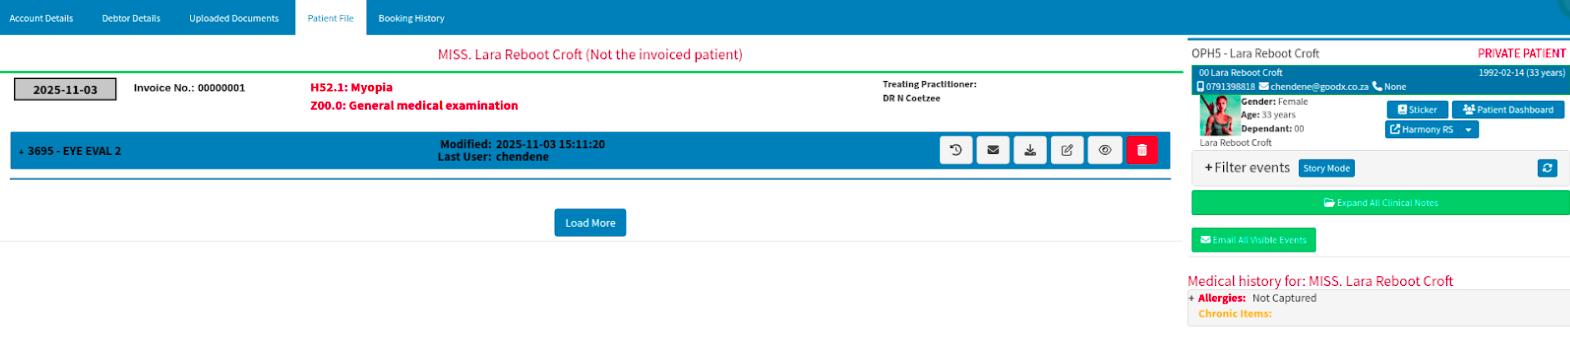
Alternatively, the patient dashboard can be located by selecting "Debtors" from the GoodX wheel and navigating to the "Debtors" tab to search for or select the debtor of interest.
If you select the desired debtor with a single click, a new panel view will appear. From there, click the"Clinical" button on the right-side panel, then select the "Patient File" tab on the top panel. This reveals a side panel with quick-access buttons, including the patient dashboard feature button.
If you double-click on the desired debtor, a new window view will open. From this view, navigate to the "Patient File" tab on the top panel to reveal the side panel with quick-access buttons and the patient dashboard feature button.
What information can be viewed at a glance?
You can also set up profiles on specific dashboard items that you prefer to view simultaneously. You can tailor these profiles to practitioner preferences or specific clinical conditions and save them with unique profile names. You can instantly toggle between these visible profiles, with a blue tick next to the profile name reflecting the profile currently in view.
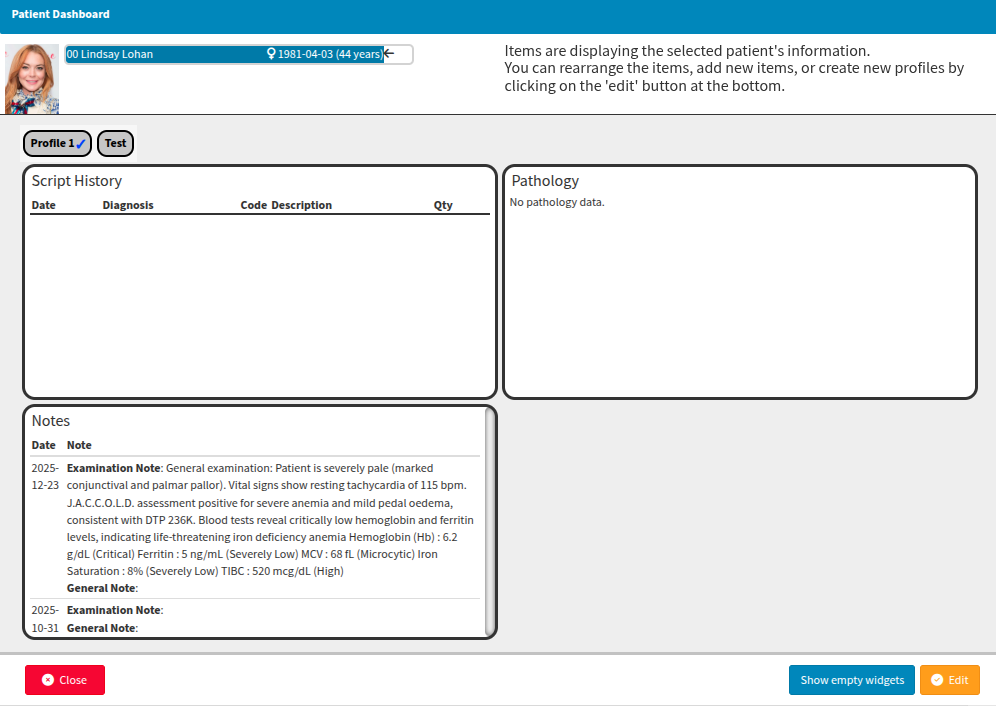
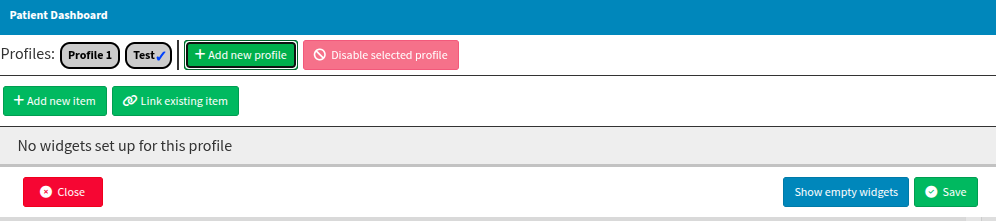
If you need to update the patient dashboard with additional information sources or new profiles, select the "Edit" option to modify your configuration.
While the initial profile setup may seem daunting at first, feel free to connect with your GoodX liaison to share your expectations for preferred colours and views (including line, scatter, text, or image graph options) and to receive guidance and recommendations for your desired patient dashboard configuration.
Always select Save to retain your changes or updates, as closing the window without saving will discard any actions completed. Graphs can only display information that was explicitly recorded and saved in the specific forms being referenced.
Examples of what can be viewed from the “Patient Dashboard”
From selected form templates, you can choose which clinical information to display on the dashboard. For instance, using data captured in the "Eye Examination" template, your patient dashboard could potentially reflect the following:
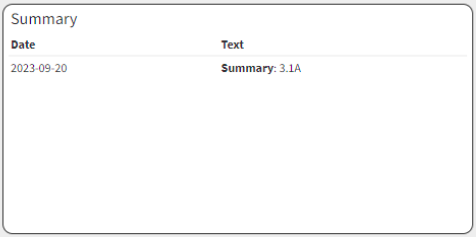
The summary notes recorded during previous examinations for the form type specified during your initial setup.
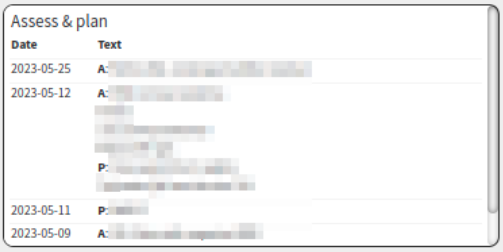
The specific Assessment (A) and Plan (P) notes pulled directly from the dedicated clinical form.
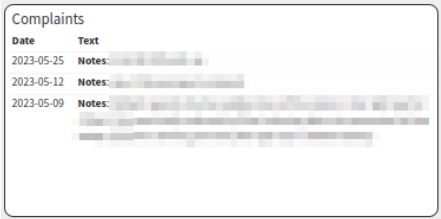
The historical record of patient complaints as reflected in the case history notes.
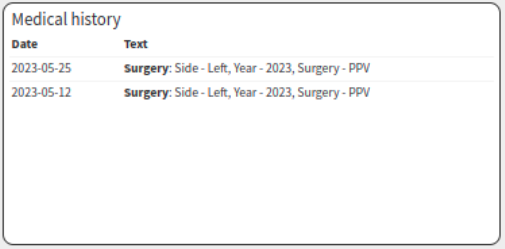
The medical history can be configured to reflect recorded medical conditions, allergies, family history, or any ophthalmic surgeries documented within the form.
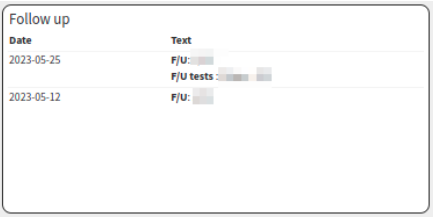
The system can display scheduled follow-up tests, specific line items, or general follow-up notes that have been recorded.
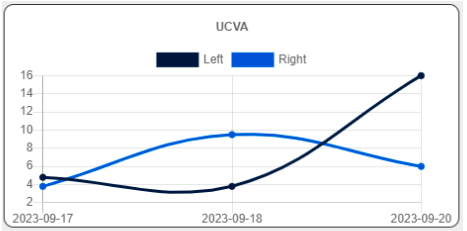
The system can track and display UCVA (Unaided Visual Acuity) for both eyes over the recorded historical timeline.
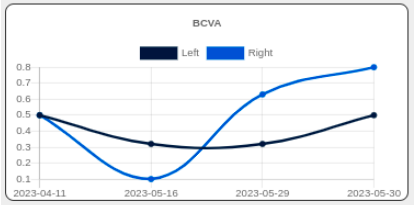
The BCVA (Best-Corrected Visual Acuity) for both eyes can be tracked and viewed over the recorded historical timeline.
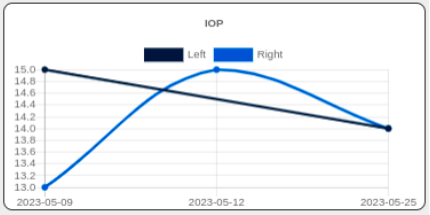
The IOP (Intraocular Pressure) values, reflecting essential eye vitals, can be monitored across the recorded time points.
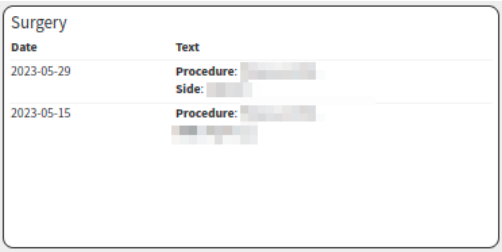
You can review completed procedures, along with the specific side or eye operated on, as recorded on the forms.
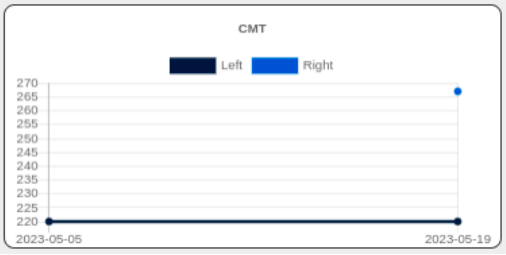
You can keep your special investigations visible, such as CMT (Central Macular Thickness) for both eyes, or display Corneal Topography for both eyes as a "Pentacam" graph.
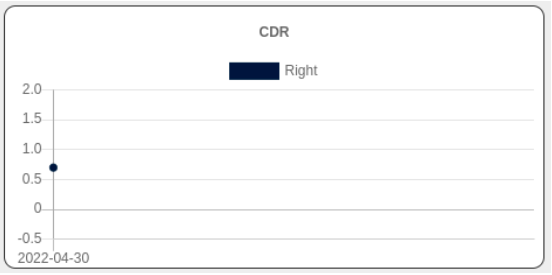
The optic disc information will display only when data is available; for example, the graph monitors both the left and right sides but will reflect only recorded information such as the right CDR (Cup-to-Disc Ratio).
Detailed information notes relating specifically to patient pathology can be displayed.
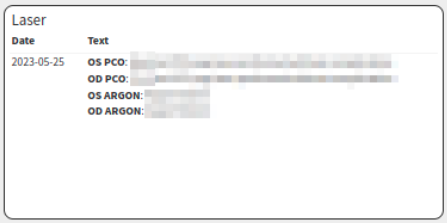
Laser procedures can be viewed at a glance, with direct reference to a "YAG Posterior Capsule Opacity" or an Argon procedure performed.
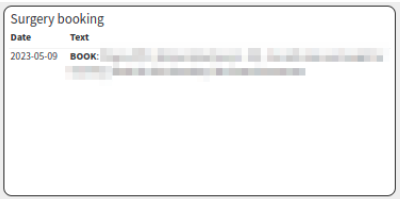
Even surgery booking procedure items can be viewed at a glance where they have been recorded on the completed eye examination forms.
If a section you use often isn't available, connect with your GoodX liaison to confirm whether that section already exists and can be added to your profile, or whether it's still in development.
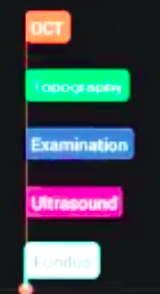
The dashboard view defaults to a royal blue theme. However, you can also colour-code your forms or related clinical notes using the Harmony colour palette, which is particularly useful when displaying multiple results on a single graph:
OCT: Orange
Topography: Green
Examination: Blue
Ultrasound: Violet / Purple
Findings: White