Why This Matters?

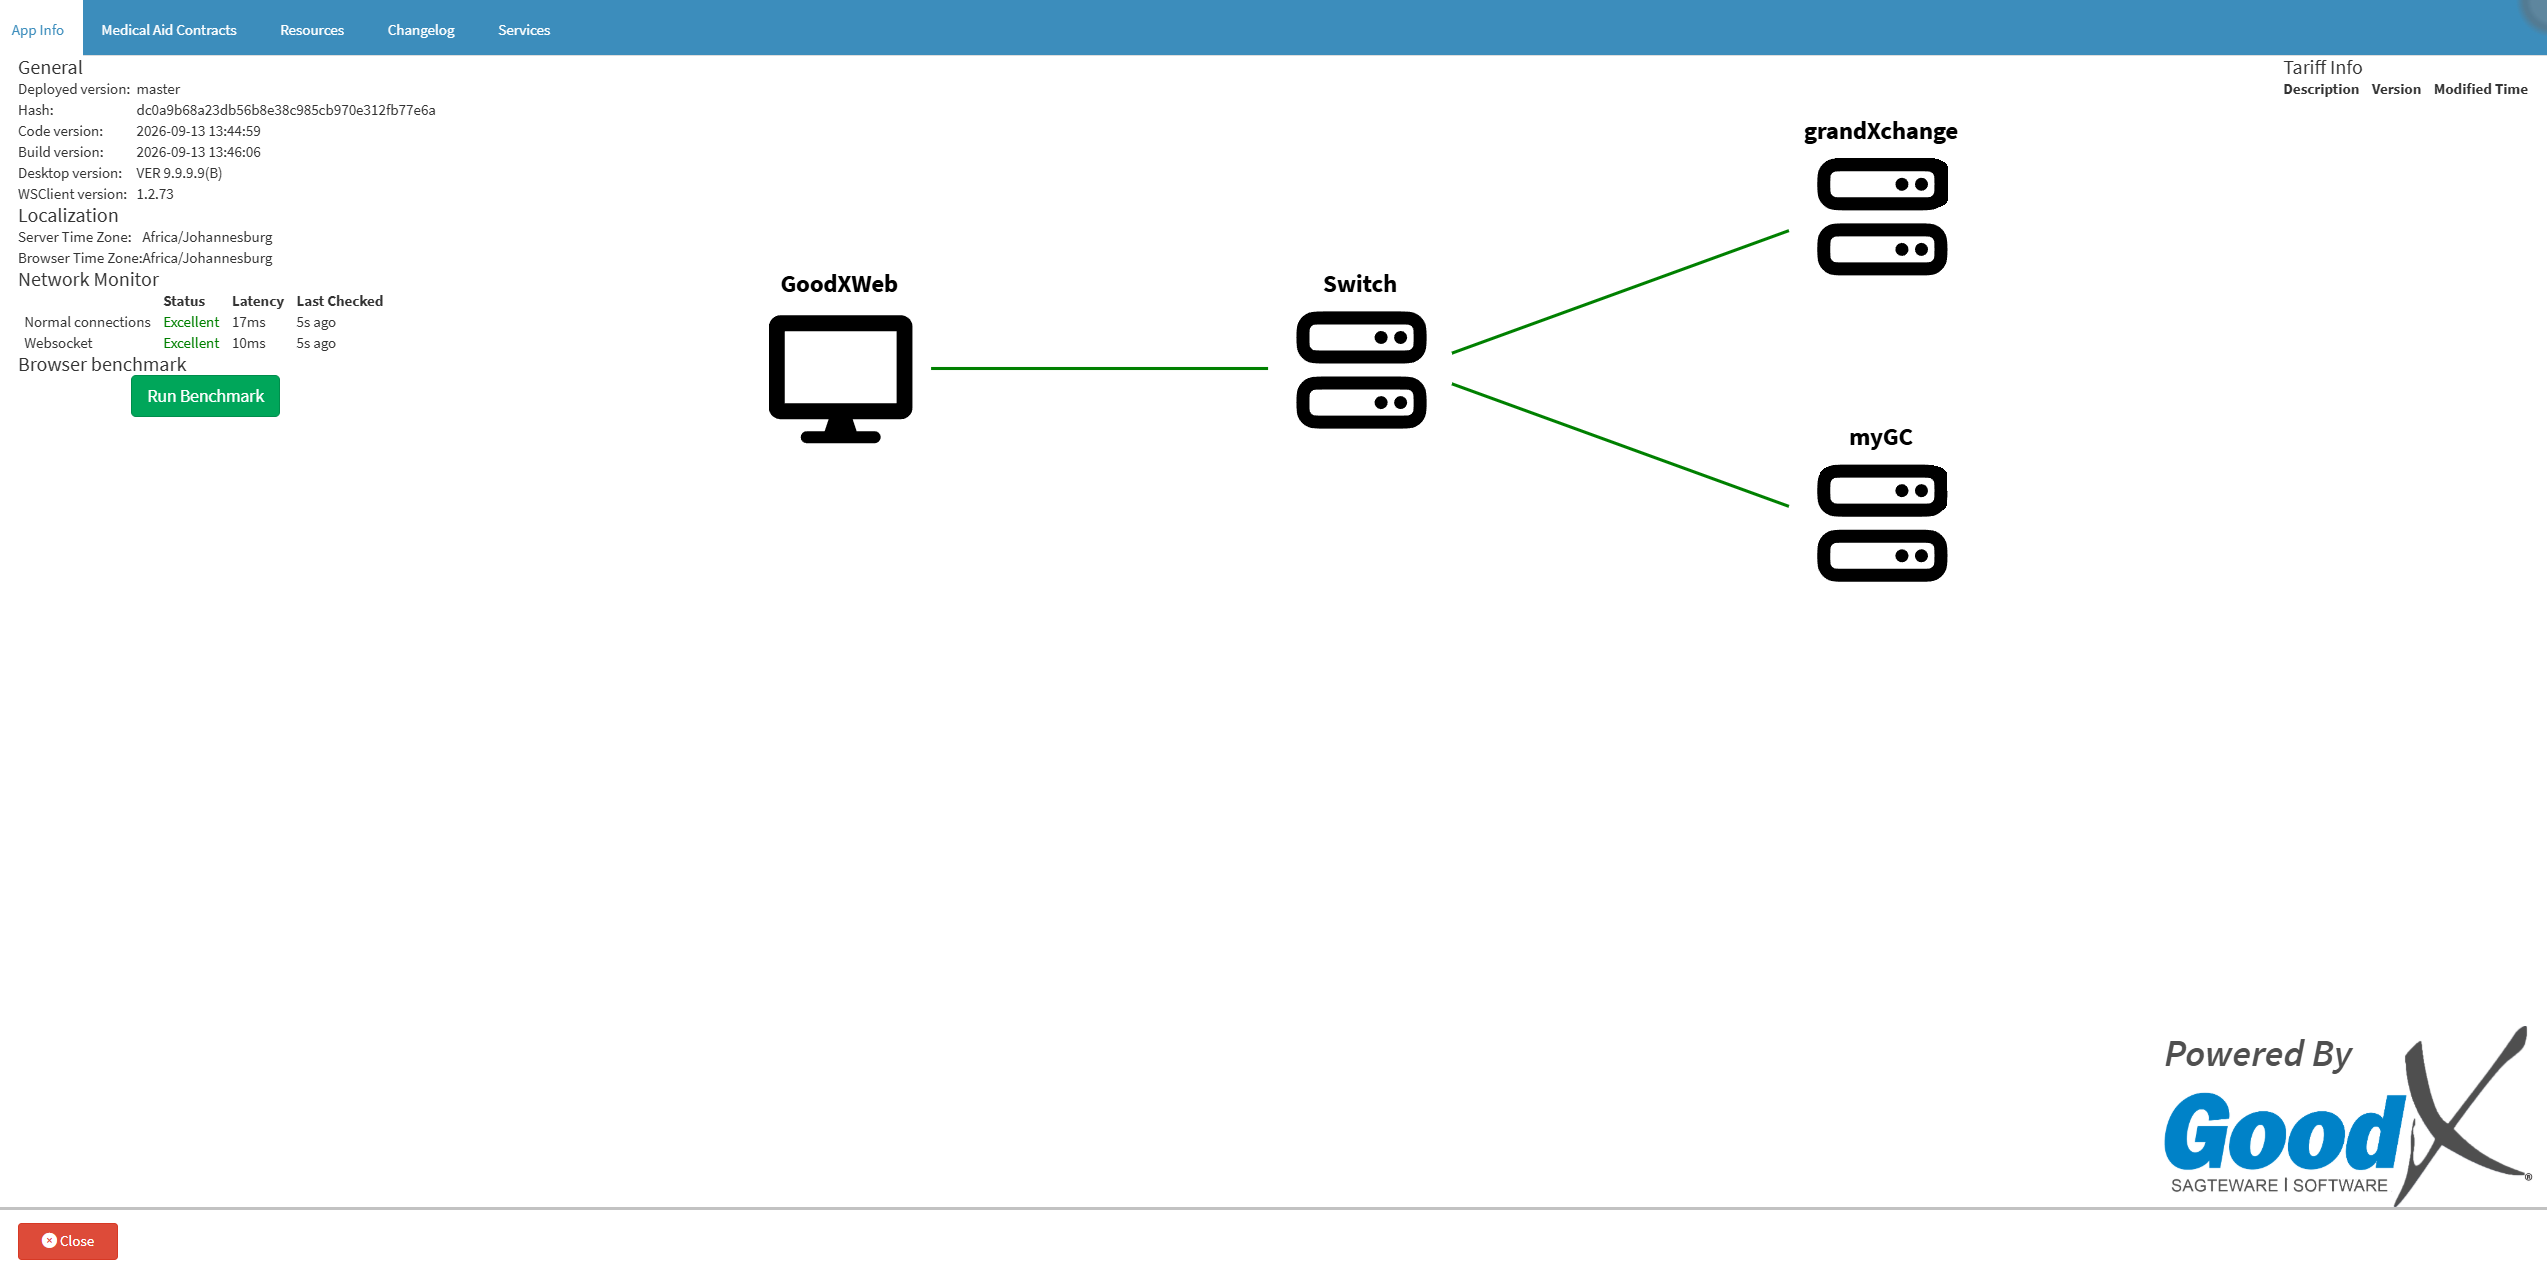
The App Info screen provides an overview of important information about your GoodX system, including your internet connection speed, software updates, and billing price lists. Having this information in one place makes it easier to confirm your system is up to date and that required services are working correctly.

Reviewing this information can help you identify connection or configuration issues that may affect daily tasks, such as submitting claims or communicating with patients. It also helps ensure you use the correct, up-to-date price lists when billing, supporting accurate and efficient practice administration.
  • Start on the App Info screen.


Sections

  • General
  • Localisation
  • Network Monitor
  • Integration Health Checker
  • Tariff Info


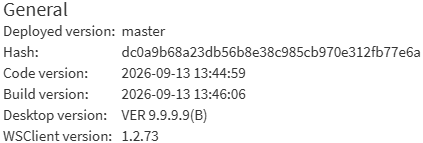
General 

  • General: This section contains developer data.

Localisation

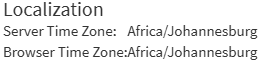
  • Server Time Zone: The time zone where the GoodX server is located.
  • Browser Time Zone: The time zone of your local device or web browser.

Network Monitor


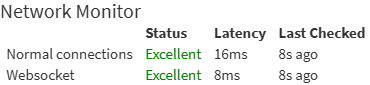
  • Status: The current rating of the program's connection in the browser.
  • Latency: The time that has elapsed before the data transfer begins.
  • Last Checked: The time that has elapsed since the last data transfer was checked.

Browser Benchmark 

  • Run Benchmark: Runs a Benchmark test on the browser to see whether the software is operating normally. For details, see How to Run a Benchmark Test.

Integration Health Checker

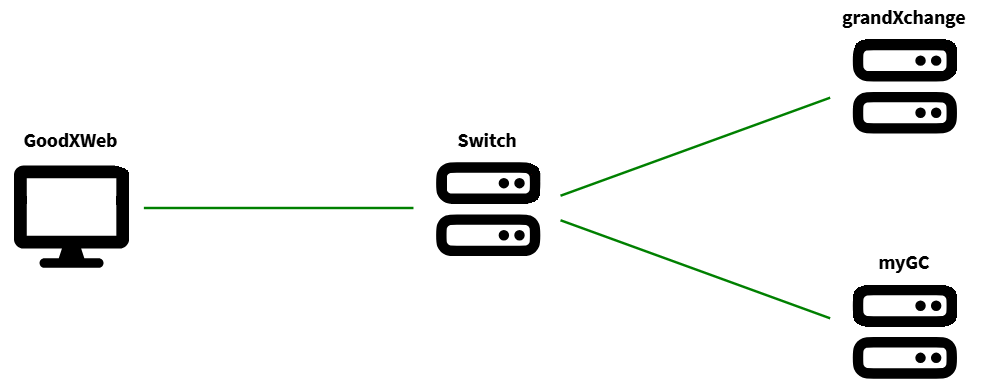
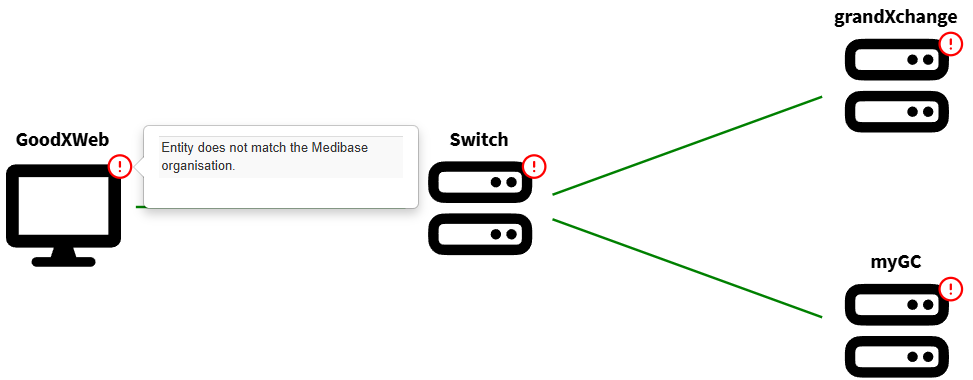
  • Integration Health Checker: Shows a map of all the connections the practice has to the Switch and external Portals.

💡Please Note: When a connection error occurs, an indicator is displayed on the relevant app; hover over the indicator to see where the problem is.


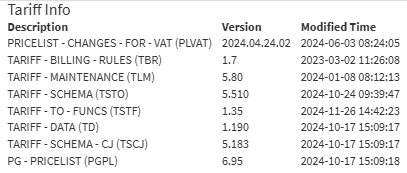
Tariff Info

  • Description: The name or type of the price list or tariff rule.
  • Version: The version number of that file.
  • Modified Times: The date and time it was last updated.
Last modified: Monday, 26 October 2026, 4:37 PM