Add/Edit Patient Dashboard Item Screen: Navigation and Use
Completion requirements
Why Use This Function:
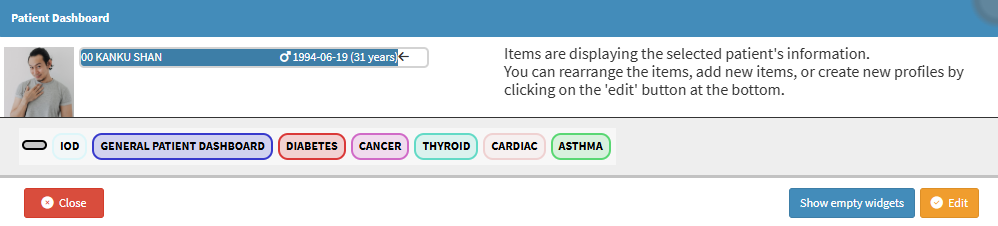
The Patient Dashboard provides a clear overview of the Patient’s details and their clinical history, from their first visit to their most recent interactions with the Practice. It brings key information together in one place, allowing Practitioners to quickly review past clinical data, recent bookings, account details, and important notes without navigating multiple screens.
Customising the Widgets or Items on the Dashboard ensures that the most relevant information is displayed according to the Practice’s workflow, supporting faster decision-making and improving the overall efficiency of Patient management.
The Contents of This User Manual:
Advanced Settings
Graphs
This user manual will start on the Patient Dashboard screen.
For more information on how to navigate to the Patient Dashboard screen, please refer to the user manual: The Patient Dashboard.
Click on the Edit button.
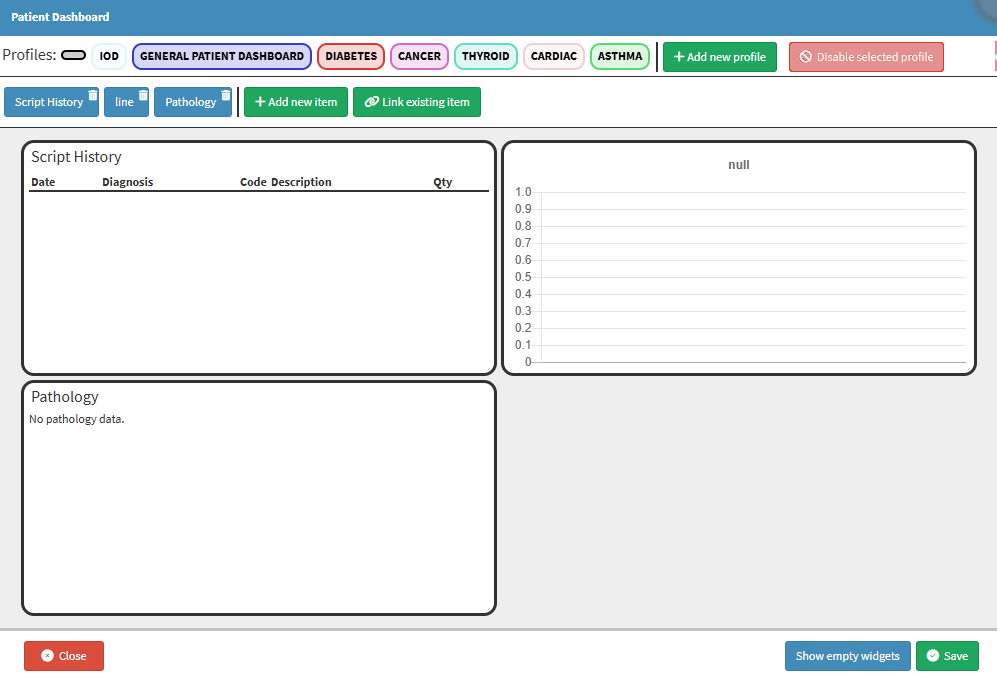
The Patient Dashboard will expand with more options.
Click on the Add New Item button.
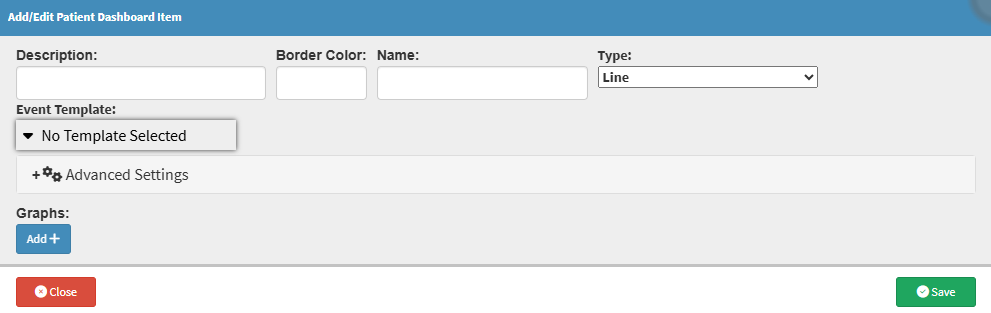
The Add/EditPatient Dashboard Item screen will open.
Click on the Description field to add a short description for the Patient Dashboard Item you are creating.
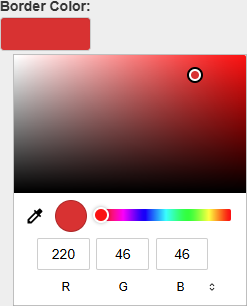
Click on the Border Colour field to select the desired colour for the border from the colour picker that becomes available.
Click on the Name field to add a name for the Patient Dashboard Item.
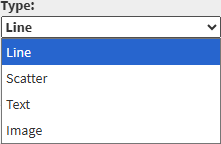
Click on the Type drop-down menu to select the format the Dashboard Item will display.
For more information on the following Type options, please refer to the following user manuals:
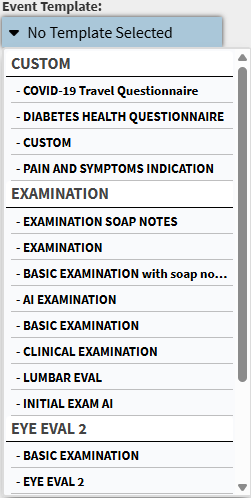
Click on the Event Template drop-down menu to select an appropriate option for the Dashboard Item.
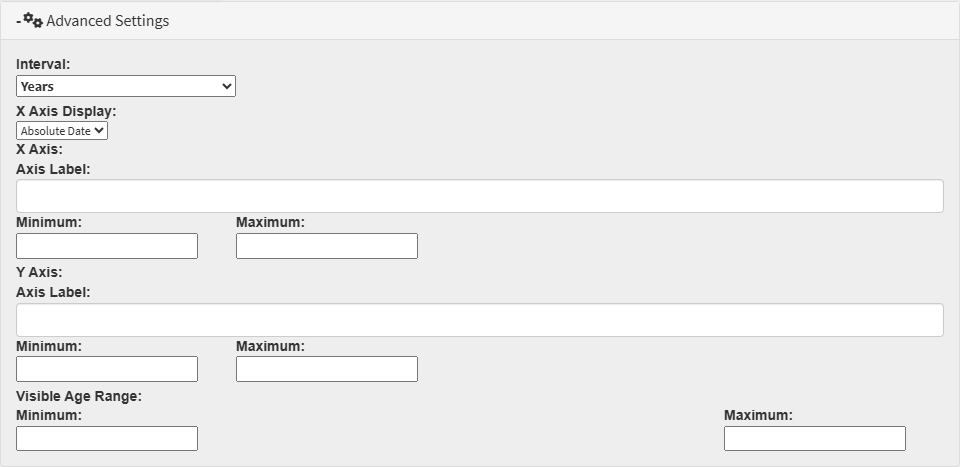
Advanced Settings
The Advanced Settings panel allows you to refine how a Dashboard Item displays data, ensuring that the intervals, axis labels, ranges, and visible values match the specific analytical needs of your Practice.
Click on the Advanced Settings panel.
The Advanced Settings panel will expand with more options.
?Please Note: These options change depending on the Type you selected in the Type drop-down menu. For more information on each option, please refer to the relevant user manual linked under the Type drop-down menu.
Graphs
Graphs provide a visual way to interpret Patient information, helping you display trends, comparisons, and key data points clearly within a Dashboard Item.
Click on the Add button to add a graph.
A New field will appear.
Click on the Name field to give your Graph a name.
Click on the Path drop-down menu to select the desired option.
?Please Note: The options on the Path drop-down menu will depend on the Event Template you have selected.
Click on the Delete button to delete the graph.
Click on the Save button to save your Patient Dashboard Item.
Last modified: Tuesday, 25 November 2025, 10:44 AM