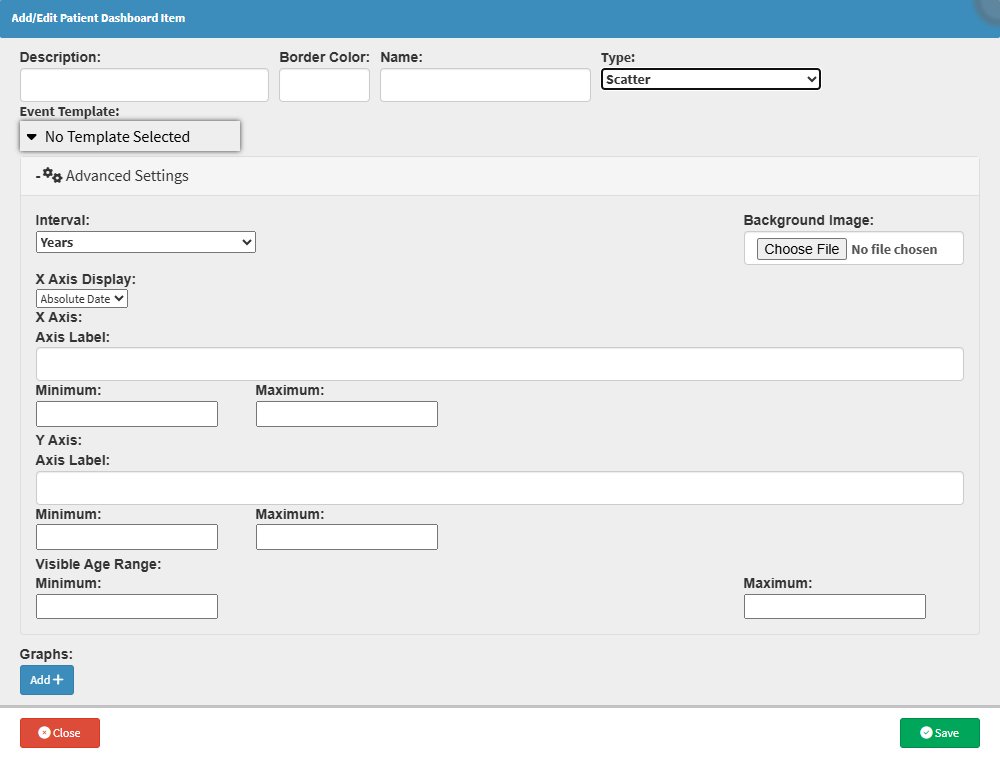
The Scatter Graph displays patient data as individual points on a graph, making it easier to compare information and see how different values relate to each other.
This gives the practitioner a clear visual overview of the patient's data, making trends, changes, and unusual results easier to spot. It can be particularly useful when monitoring information over time or comparing different clinical measurements, helping the practitioner better understand the patient's information and make more informed clinical decisions.
Start on the Add/Edit Patient Dashboard Item screen.