Glossary: Adding/Editing Items on the Patient Dashboard
VIDEO
Why This Matters? Adding or editing items on the Patient Dashboard lets you customise the information displayed to suit your workflow. You can choose the widgets and information that are most relevant to your workflow, keeping the Dashboard focused on what you need.
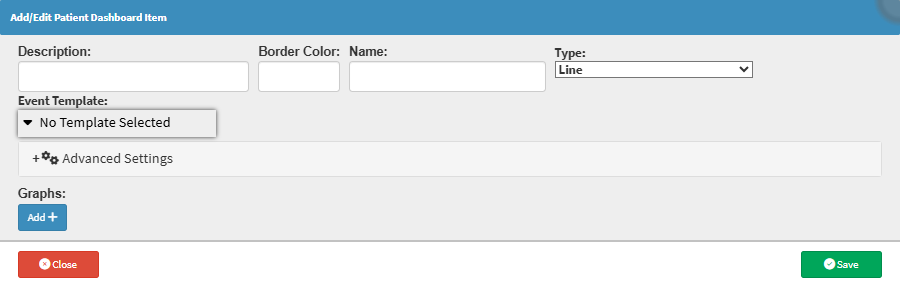
Start on the Add/Edit Patient Dashboard Item screen.
Sections
Basic Information
Event Template
Advanced Settings
Graphs
Basic Information
Description: Details or explanation of the dashboard item.Border Colour: Outline colour choice for the item box. Name: Title displayed for the item on the dashboard. Type: Format used to present the clinical data.
Line: Visual line graph showing numerical trends and changes over time. For details, see How to Add a Line Graph to the Patient Dashboard .Scatter: Plot graph highlighting individual data points, measurements, or correlations. For details, see How to Add a Scatter Graph to the Patient Dashboard .Text: Plain text readout for values, summary details, or clinical notes. For details, see How to Add a Text Graph to the Patient Dashboard .Image: Visual display for clinical photos, diagrams, or medical imaging. For details, see How to Add an Image Graph to the Patient Dashboard .PDF: Embedded view for document files, reports, or attachments.
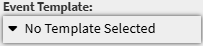
Event Template
Advanced Settings
Advanced Settings: Source clinical template supplying the data to this item.
💡Please Note: Options depend on the selected Type; see the Type drop-down user manuals for details.
Graphs
Graphs: Setup area for adding and configuring graph data series.Add: Create a new graph entry.Name: Descriptive label or title assigned to the specific graph.Path: Data field or clinical measurement tracked by the graph.Delete Button: Remove the graph entry from the list.
💡Please Note: A graph item must first be added using the Add + button before its lines can be configured.
Last modified: Friday, 30 October 2026, 10:25 AM