Text size
Line height
Text spacing
The Text Graph displays patient information in a simple table format, making it easy to view specific details and compare values. In the example shown, you can view information such as dates and the number of days together in an organised format.
This makes it easier to review patient information at a glance and identify relevant details without working through individual records, and it gives the practitioner another clear, practical way to view the patient's information when reviewing clinical data.
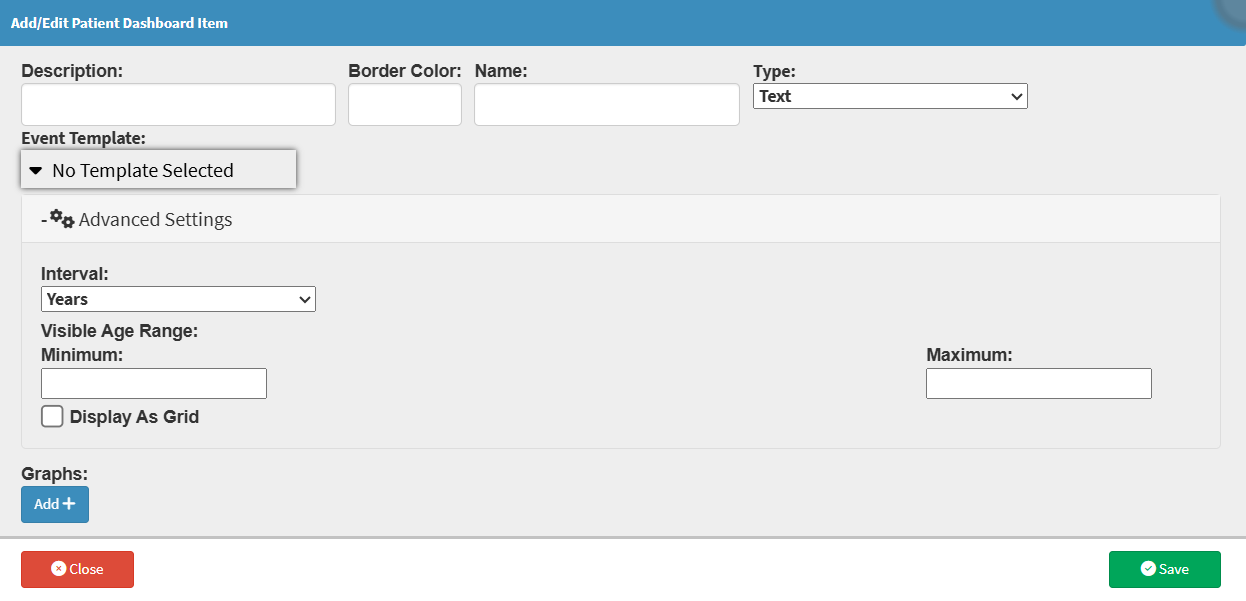


💡Please Note: If the template doesn't use an age range, you don't need to fill in these fields.