Why This Matters?

The Line Graph displays patient data over time, making it easier to see how information changes from one point to the next. The connected points provide a clear visual view of trends, progress, or changes in the patient's information.

Using the Line Graph makes it easier for the practitioner to monitor changes over time, compare information, and spot trends or unusual results. This provides a simple visual way to review the patient's progress and supports better clinical assessment and decision-making.

  • Start on the Add/Edit Patient Dashboard Item screen.
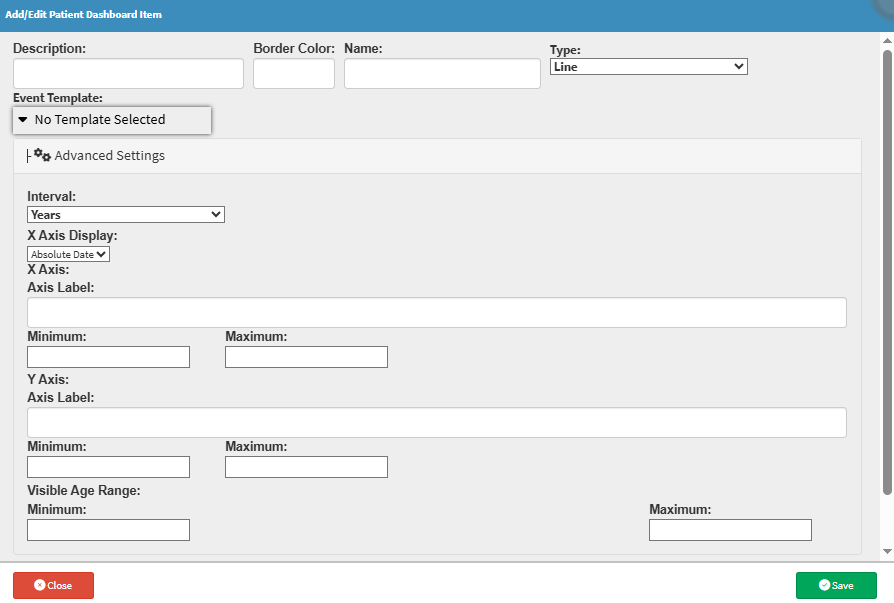
Sections

  • Interval
  • X-Axis Display
  • X-Axis
  • Y-Axis
  • Visible Age Range

Interval

  • Years: Defines the interval in years.
  • Months: Defines the interval in months.
  • Days: Defines the interval in days.

X-Axis Display

  • Absolute Date: Specific calendar dates displayed chronologically.
  • Patient Age: The patient's age at each recorded data point.

X-Axis

  • Axis Label: Custom label displayed along the horizontal (X) axis.
  • Minimum: Starting value for the X-axis. 
  • Maximum: End value for the X-axis

Y-Axis

  • Axis Label: Custom label displayed along the vertical (Y) axis.
  • Minimum: Starting value for the Y-axis. 
  • Maximum: End value for the Y-axis. 

Visible Age Range

  • Minimum: Starting age used in the graph.
  • Maximum: End age used in the graph.

💡Please Note: If the template doesn't use an age range, you don't need to fill in these fields.

Last modified: Tuesday, 27 October 2026, 10:41 AM



