Best Practice Guidelines: Healthcare Management Internal Controls
Best Practice Guidelines: Healthcare Management Internal Controls
Copyright © 2020 GoodX Software. All rights reserved.
GoodX online Learning Centre
learning.goodx.co.za
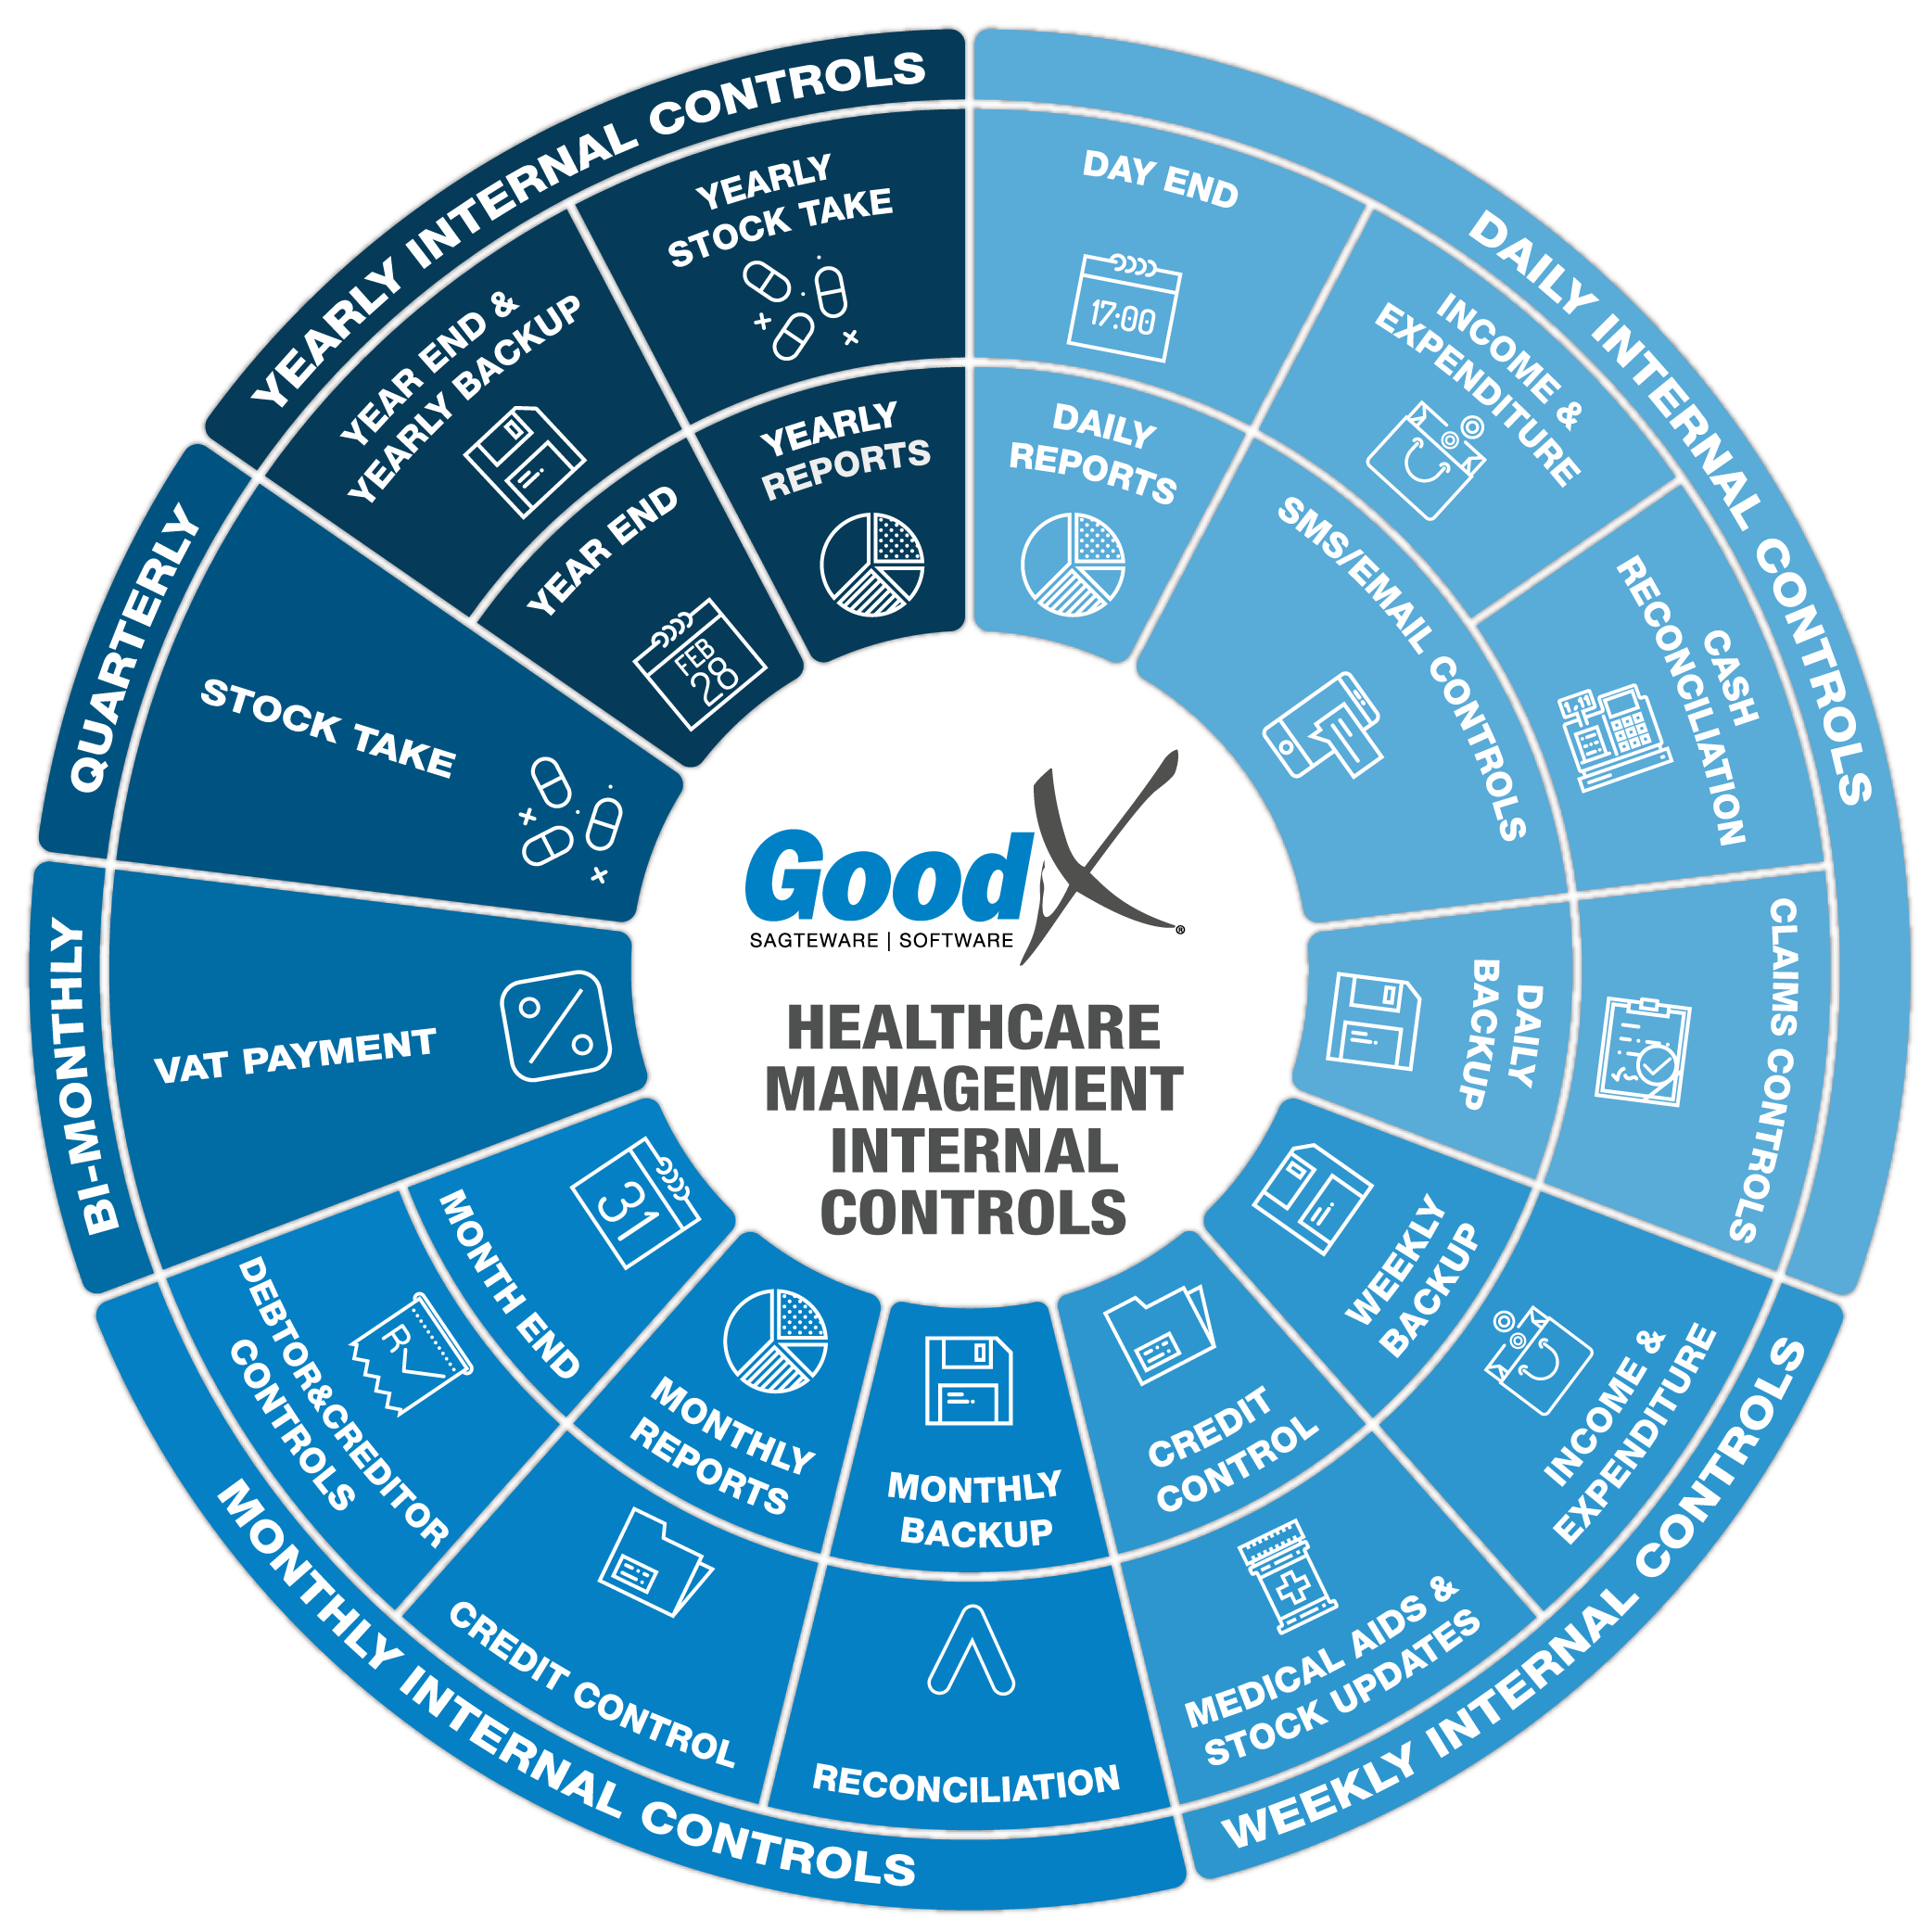
4. Monthly Internal Controls Summary
4.5. Monthly Reports
Monthly reports will assist in showing the growth or declineof the business processes and financials.
The Monthly reports will show the big picture of what is happening in the practice on a day-to-day basis. Each report has its own importance and unique information.
Many of these reports have been discussed in the different Monthly controls, please also refer to the different sections to understand the reporting process.
The reports have the following functions:
- Filters on each column
- Export to Excel or CSV
- Advanced filters and advanced export functions
- Print the report or choose which columns must be printed
- Email the report or choose which columns must be emailed
- Group by columns in levels by dragging the column to the top

1. Debtor Transaction drill down report
The Debtor Transaction drill down report, also known as the Daybook report, is one of the most useful reports of all. The report can be used for various different scenarios. The following monthly Debtor reports can be generated:
- Ledger report
- Audit trail report
- Audit trail invoice detail report
- Movement summary report
- Summary per billing code report
- Summary per IDC10 report
- User activity report
- Deposits report
- Journal summary report
a. Ledger report
The Ledger report groups all transactions into various sections. For example: Debtors invoices, Credit notes, Deposits (Cash, Card, Electronic and ERA), and Journals. The Ledger report also contains the Debtors control account (CAS001).
The Ledger report has an opening balance from the previous period and a closing balance for the current period.
All transactions are summarised and the movement total of all the Debtors for a certain period is displayed.
b. Audit trail report
The Audit trail report contains all debtor transactions for a specific period. Report detail is on invoice level. The report is used for fault finding and grouping information according to needs. Report columns are the same for all types of transactions but only the information applicable to that transaction will display in the column.
The following columns can be found in the report:
- Transaction date, capture date and financial year
- Batch number, document number and split number
- Ledger account
- Debtor account number, file number and case number
- Debtor initials and surname
- Credit note and journal description
- Journal actions
- Amount exclusive of VAT
- VAT amount
- Amount inclusive of VAT
- The user that posted the transaction
- The patient portion on the amount
- Treating provider and referring provider
- Service centre
- Billing group and price list collection
- An indication of the number of transactions per transaction type
- Total amount per transaction type and grand total for all transactions
c. Audit trail Invoice detail
The audit trail invoice detail displays all debtor transactions for a certain period, on item level. This report is similar to the audit trail but this report contains bills for all accounts, with more information where applicable. The report is used for fault finding, grouping information, or filtering specific codes or stock items that were billed to patients. Report columns on the report are the same for all types of transactions but only the information applicable to a specific transaction will display in each column.
The following extra information is available in the report:
- Patient ID
- Medical aid name and medical aid number
- Code (Stock code or Tariff code)
- Description (Stock description or Tariff description)
- ICD-10 code
- The quantity that was billed as QTY
- VAT percentage that was charged for each line
- Cost of sales
- Patient name and surname
- Nappi code
- Default billing group, posting billing group and price list
- Modifier code
- Authorisation number
d. Movement summary report
The Movement summary report is key to practice management. The report indicates turnover, cash flow and journals on debtors, and balances back to the age analysis showing outstanding accounts for a specific period.
The report can be generated per practitioner indicating turnover per practitioner. Depending on practice needs, the report can be filtered or grouped to assist in getting the required information.
The report is divided into six sections:
- A. Opening balance
- B. Turnover
- C. Cashflow
- D. Journals
- E. Posted after the period
- X. Totals
The following columns are available in the report:
- Ledger, description and the type of transaction
- Amount excluding VAT
- VAT amount
- Total amount including VAT
The following information is displayed under the different sections:
A. Opening balance
The opening balance from the previous period
B. Turnover
Turnover is the income per patient treated and billed, and is also known as gross income, or as total income received. Turnover is grouped by various types of income (for example, procedure, material or medicine) with a positive amount. Under turnover, credit notes are displayed as a negative.
Turnover will be the amount from the invoices minus the amount from the credit notes for a specific period.
C. Cashflow
Cashflow represents all cash, card or any other type of income payment. Cashflow forms an important part of any practice, facilitating day-to-day expense payments. Without healthy cash flow management, a practice can fall into financial difficulties which can lead to bankruptcy.
The cashflow section is grouped by different types of deposits (receipts) and is displayed as negative amounts. Corrections (receipts written back) are displayed as positive amounts. The difference between the two displays the total cash flow for a specific period.
D. Journals
Journals are usually done for three main reasons, namely: bad debts, settlement discounts and small amounts written off. Under the journal section, transactions are grouped by different journals captured. Journals can reflect negative or positive amounts, depending on the journal type. Journals don't correct or change turnover or cash flow.
E. Posted after the current period
Transactions displayed under this section are all the transactions that were posted in a future period, with transaction dates in the current period, or linked to transactions in the current period. These transactions need to be investigated by the practice.
X. Totals
The total is calculated in the following manner:
Opening balance + Turnover - Cashflow + or - Journals + or - transactions posted after the period = Total = Age Analysis
A + B - C +/- D +/- E = X
The total must always balance back to the age analysis total for the same period, which indicated good practice data integrity.
e. Summary per billing code report
The code report can be used by the practitioner to see which procedure, treatment and consultations were done. The code report will show which items were most often used. The report can assist in making decisions on which treatments or procedures to keep on doing or which should be stopped because of low-income benefits to the practice.
The following information can be viewed in the report:
- Code (tariff or stock code)
- Description or name
- Units billed
- Number of times billed
- Total amount excluding VAT per code
- Total VAT amount per code
- Total amount including VAT per code
- Unit price
- Total of all units billed for all codes
- Total amount billed for all codes (VAT exclusive amount, VAT amount, and VAT inclusive amount)
f. Summary per ICD10 Code report
The ICD-10 report shows how many patients were treated by a practitioner in a period for different types of diagnosis. This report assists practitioners in making various choices, for example, what type of diagnoses is most common, and which stock items should be kept on hand.
Practices must also report to the government's Health Department on the number of diagnoses per period. This information is used by the Health Department to evaluate when there are outbreaks of certain illnesses.
Report lines are grouped according to transaction type and are grouped by ICD-10 codes and the number of occurrences per code per period.
g. User Activity report
The user activity report gives an indication of who in the practice does what on the system. The report is grouped per user. Under the user name, different transaction types are displayed with the total number of transactions and the total amount the transactions are worth.
h. Deposit report
The Deposit report displays all receipts that were captured on the system, grouped by payment method, including receipts written back.
The report can be used for fault finding and for reconciling cash, card and EFT payments on a daily basis when the practice is not utilising the cash register function.
The following information is available in the report:
- Transaction date and capture date
- Deposit number
- Detail of the receipt or correction
- The user who posted the transaction
- Total that was received or written back
- Total grouped per receipt type
The report can be printed at the end of the day. The cash in the cash bin needs to be counted and reconciled back to the cash section (subtracting cash corrections and the float in the cash bin).
The card payment total on the report minus card corrections must reconcile with the card slip that was printed at the end of the day at the card machine.
i. Journal ledger summary report
The journal ledger summary report summarises different journals that were captured on different debtor accounts into the ledgers that the journals were posted to. This assists the practice manager to find errors that were made when posting the journals, by investigating large or unauthorised amounts.
2. Debtor age analysis
The debtor age analysis only displays outstanding accounts and accounts that are in credit. Zero accounts can also be displayed on the full age analysis, but can be filtered out. These are the accounts that have no amounts due.
A debtor age analysis is divided into the following:
- Total outstanding amount
- Medical aid outstanding
- Private patient outstanding
- Current outstanding
- 30 days outstanding
- 60 days outstanding
- 90 days outstanding
- 120 days outstanding
- 150 days outstanding
- 180 + days outstanding
The columns from current until and including 180 + days will be added together to make up the total outstanding per line or per account. The totals at the bottom of each column indicate the sum for each column.
It is noteworthy that negative amounts (credit amounts) are deducted and will decrease the total.
a. Outstanding accounts
Best practice is to have no outstanding private patient accounts for 90 days and older, and to have no outstanding medical aid patient accounts for 60 days and older.
Use the age analysis to identify accounts that need to be followed up: a regular process should be put in place nominating which week to use for following up on outstanding accounts. For example: the first week of each month can be used to follow up on all 30 days outstanding accounts, the second week of the month to follow up on all 60 days outstanding accounts, etc.
Remember to make notes in the notebook when following up on each account.
b. Credit accounts
Credit amounts on the age analysis mean that those accounts are in credit and that the practice owes money to those medical aids or patients.
When the credit amount is on the patient part, a refund should be arranged with the patient.
When the credit amount is on the medical aid part, the credit should be kept until the medical aid pulls the amount back on the following payment from the medical aid.
3. Debtor statistics
The Debtor statistics report only shows a summarised view of the Turnover, Cash Flow and Journals per the specific grouping that was selected. Depending on the settings the detail can be expanded. The report can be customised to give the required information.
The report is very useful for salary calculations. The report shows a summarised turnover per practitioner depending on the setup and depending on the agreement with the practitioner, his or her salary can be calculated.
For example, some practitioners earn a percentage of their turnover.
Grouping can be done by:
- Treating Practitioner
- Referring Practitioner
- Medical aid administrators and schemes
- Service Centres
- Transaction Date, Capture Date or Period
The Turnover per Practitioner report will be set up in the Debtor statistics report and linked to the Turnover per practitioner.
The report has a Custom Advanced filter for more detail and you can filter on certain codes that can be summarised into sections.
4. Invoices outstanding
The Invoices outstanding report will display all the invoices that have not been paid. The report must be checked on a daily and monthly basis for good credit control.
The following information can be found in the report:
- Account and File number
- Account Name
- Invoice date
- Invoice number
- Invoice detail
- Invoice amount
- Received for the invoice
- Journals
- Outstanding
- Medical aid outstanding
- Private patient outstanding
- Account total (Age Analysis)
- Total
- Medical Aid
- Patient
- Ageing
- EDI Status
- The total amount per column
On each line, you will be able to see which invoices are outstanding, the amounts outstanding, the age of how long the transactions are outstanding and if the transactions were switched to the medical aid or not. This is a handy report to check the status of invoices.
The age is colour coded to highlight the outstanding invoices. The age colours start from green and get a little darker until they are red. Green would typically be 30 days outstanding which is not long and the collectability of the invoices is good, orange amounts are more difficult to collect and red amounts are long overdue and therefore very difficult to collect.

1. Creditor Transaction Drilldown Report
This report is used to generate the following monthly reports of the Creditors:
- Ledger report
- Audit trail report
- Audit trail invoice detail report
a. Ledger report
The Ledger report groups all the transactions into different sections, eg Creditor invoices, Credit Notes, Journals and Cheques.
The Ledger report will also have an opening balance from the previous period and a closing balance for the current period.
This is only a summary that summarises all the transactions and gives the movement total of all the Creditors for a certain period.
b. Audit trail report
The Audit trail shows all the debtor transactions that were done for a certain period. The details will be on the invoice level. The report can be used for fault finding and grouping information. The different columns in the report will be the same for all types of transactions but only the information applicable to that transaction will display in the column.
The following information will be found in the report:
- Transaction date, Capture date and Financial Year
- Batch number, Source Doc number and Split number
- Ledger account
- Creditor Account number and File Number
- Creditor Name and Creditors Full Name
- Credit note and Journal description
- Journal Actions and Journal Account number
- Amount without VAT
- VAT amount
- Amount including VAT
- The user who posted the transaction
- Price list collection
- The number of transactions per transaction type - Count
- Total amounts per transaction type and the big total for all the transactions added together.
c. Audit trail Invoice detail
This Audit trail shows all the creditor transactions that were done for a certain period. The details will be on the item level. The report focuses on the items that were received or services that were rendered to the practice, on all the creditor accounts, with more information applicable to the lines. The report can be used for fault finding and grouping information or filtering on certain codes or certain stock items. The different columns in the report will be the same for all types of transactions but only the information applicable to that transaction will display in the column.
The following extra information will be found in the report:
- Code
- Description (Stock Description or Service Description)
- The quantity that was received or credited - QTY
- VAT % that was charged on the line
- Price list and Price list collection
- Modifier code
2. Creditor age analysis
The creditor Age Analysis must balance back to the statements of all the Creditors for the month. The Creditors Age Analysis shows all the Creditors who still need to be paid.
The following information will be on a Creditor Age Analysis:
- Account Number
- File Number
- Creditor Name
- Balance
- Current Outstanding
- 30 Days outstanding
- 60 Days outstanding
- 90 Days outstanding
- 120 Days outstanding
- 150 Days outstanding
- 180 + Days outstanding
- The total amount per column outstanding
The columns from Current until and including 180+ will be added together to make up the Total outstanding per line or per account. The totals at the bottom of each column is the sum of all the amounts from top to bottom.
Please remember that the negative amounts (Credit amount) will be deducted and will make the totals less. The negative amounts on the Creditor Age Analysis means that the practice is in credit with the Creditor and that the Creditor is owing the practice money.

Explanation of some key points in the report detail:
- The minus quantity and value means that the item is used or reduced from the stock quantity and this will make the stock less.
- The plus quantity or value means that the items were added or purchased and makes the item more.
- When the opening balance is incorrect this means the previous period transactions were incorrect.
- When unsure where to start fault finding, first check the user who posted the transaction.
- Check the type of transaction to have an idea of where the transaction was posted.
- Purchases come from the Stock Module and will be on a Creditor account.
- Sales come from the Diary or MedDebs modules and will be on a Debtors account.
- Adjustments will come from the Stock module and will be an Adjustment posted or from a stock take.
- The Transfer comes from the stock module and will be a transfer between warehouses. The one warehouse will be a plus and on the other warehouse, there will be a minus.
- The Closing balance is the opening balance, plus and minus the movement for that period.
- If the GP% is in a minus this means that you are making a loss on those items.
- The rand value of the items is the weighted average depending on your setup.
- Transfers must always balance each other out, meaning the plus must be in one warehouse and the minus in another warehouse. The total on the columns must be the same, only one with a negative amount and the other with a positive amount.
- The total of all the items included in the report will be at the bottom of each column.
1. Stock Report Writer
The Stock Report writer has a lot of information that can be used to show the big picture of the stock in the practice. The Stock report writer report can be drawn per single item, per a list of items or for all the items that have movement.
The Stock report writer is used for Stock on hand, to see the stock that the practice currently has. The stock report writer will always include the totals until the day the report is generated. The Stock report will also be used by the financial auditors and will be included in management reports.
The Stock report writer report can be set up with the columns and information as required.
The Stock report writer allows you to set up your own report with the information the practice requires.
If there are descriptions on the reports, please refer back to the glossary in the GoodX Learning Centre for the explanation if it is not mentioned in the Stock Guidelines book.
The following details will display on the report for each item depending on the report setup:
- System code, Item code and Nappi Code
- Item description, Full description and Manufacturer
- Category
- Volume, Volume Presentation and Strength
- Presentation (What kind of stock item, eg tablets, syrup or ampules)
- Sales Price, Markup, Purchase Price and Last Purchase Price
- Average Cost and Weighted Average
- Pack Size
- Schedule
- Ledger
- Stock Active
- Stock Type
- Discontinued
- MMAP Price, MPL Price, Mediscor Price, MNMP Price, CAP Price and QMP Price
- Minimum, Re-Order and Maximum QTY
- Year (Financial Year)
- Closing QTY and Closing Balance (Rand Value)
- Sales QTY and Sales Value
- Purchases QTY and Purchases value
- Sales Ct Notes QTY and Sales Ct Notes Value
- Purchases Ct Notes QTY and Purchases Ct Notes Value
- Adjustment +/- QTY and Adjustment +/- Value
- Transfer +/- QTY and Transfer +/- Value
2. Stock Movement per Period
The Stock movement per period report will be used to see the summarised transactions of the stock items. The Movement per period report can be drawn per single item, per a list of items or for all the items that have movement.
The Movement per period report takes the movement per type and summarises it into columns. This produces a shorter report and still displays the type of movements on the item. When the detail is needed to investigate the total, the Stock movement per detail must be used.
The report can only be drawn between financial periods and not between transaction or capture dates.
The Movement per period will be one of the Management reports that management will need on a monthly basis. This will indicate all the Sales and Purchases and all the Adjustments and Transfers, with quantity and Rand value that took place for the financial period or periods that were chosen.
The Movement per period report can be set up with the information as needed.
If there are descriptions on the reports please refer back to the glossary in the GoodX Learning Centre for the explanation if it is not mentioned in the Stock Guidelines book.
The following detail will display on the report for each item depending on the report setup:
- System Code, Item code and Nappi Code
- Item description and Manufacturer
- Pack Size
- Opening balance quantity for the financial period (Total Units)
- Opening balance value for the financial period (Total Rand Value)
- Sales Qty, the units that were sold for the financial period
- Sales Value, the sales Rand value that was sold for the financial period
- Sales CrNote Qty, the Credit processed on patient accounts.
- Sales CrNote Value, the Credit notes Rand value processed on patient accounts.
- Purch Qty, the units that were purchased through the Creditors for the financial period.
- Purch CrNote Qty, the units that were credited through the Stock credit notes (Debit notes)
- Purch Value, the Rand value that was purchased through the Creditors for the financial period.
- Purch CrNote value, the Rand Value that was credited through the Stock credit notes (Debit notes)
- Adjustment + Qty, the units that increased the stock levels and that were done using an adjustment.
- Adjustment + Value, the Rand value that increased the stock value by using an adjustment.
- Adjustment - Qty, the units that decreased the stock levels by use of an adjustment.
- Adjustment - Value, the Rand value that decreased the stock value by using an adjustment.
- Transfer + Qty, the units that were transferred from another warehouse to this warehouse.
- Transfer + Value, the Rand value of the units that were transferred from another warehouse to this warehouse.
- Transfer - Qty, the units that were transferred from this warehouse to another warehouse.
- Transfer - Value, the Rand value of the units that were transferred from this warehouse to another warehouse.
- Cl/Balance Qty, Closing units balance. The opening units plus and minus the movement.
- Cl/Balance Value, Closing Rand value balance. The opening rand value plus and minus the movement. This will be the Rand Value of all the items included in the report setup.
- GP% - GP% is the Gross Profit %. This is the profit that you have made on the item for this financial period, or if the % is in a minus (negative) you have made a loss on the item for this financial period.
3. Stock Usage Report
The Stock Usage report will indicate the total stock that was used for a certain period. The usages can be grouped per medical practitioner or service centre to assist in showing which practitioner or service centre is making a loss on their stock or a profit on their stock. The important functions of this report are to indicate the items that were used for a certain period and indicate if there was a loss or profit on the items.
The report can be used to indicate the slow-moving stock by drawing the report for a 6 months period and filtering on Units sold with a Zero quantity.
The following information can be found in the report:
- System and Item Code
- Item Description
- Units on Hand
- Units and Packs Sold
- Packsize
- Sales Value and AVG Sales Unit price
- Cost of Sales and Cost per Unit
- Gross Profit (%) and Gross Profit (R)
- Schedule
- Sales Price
- Totals on the columns

1. Cashbook report
Cashbook reports are divided into auxiliary cash books and main cash books. The cashbook report shows all receipts and receipts written back, cheques and cheques written back for a selected cashbook within a certain period. The report is drawn per cashbook, for example:
- Auxiliary cash books:
- Cash
- Card
- Electronic/EFT
- ERAs
- Main cash books:
- Bank
- Petty cash
- Home loans
- Credit cards
- Petrol cards
The cashbook report can be used for fault finding and to recon every day, week or month to the correct type of receipt that was done.
The following information can be found in the cashbook report:
- Opening balance and closing balance
- Batch number and document number
- Transaction date and capture date
- Recon number
- Description
- Amount without VAT, VAT amount and the amount including VAT
- The user who posted the transaction
- Running total
- Closing balance for the current period
2. Income Statement
An income statement reports the two elements of financial performance, that is revenue that was earned and expenses that were incurred to earn the revenue. The difference between the revenue and expenses results in the profit or loss for that specific period. The various types of revenue and expenses are shown as separate items in the income statement.
The Income ledger accounts start with - INC
The Expense ledger accounts start with - EXP
The income statement reflects in short the income of the entity as well as the expenses incurred to generate that income.
Income and Expenditure are used to calculate the Profit or Loss of a Business. You will use an Income Statement to indicate the Profit and Loss of a Business.
The profit earned by the business increases capital and the loss of business will decrease the business capital.